The React Graph Gallery
A website with hundreds of chart example made with React (and d3.js)
👋 Hi!
This week, I am very proud to release a project I have been working on for about a year!
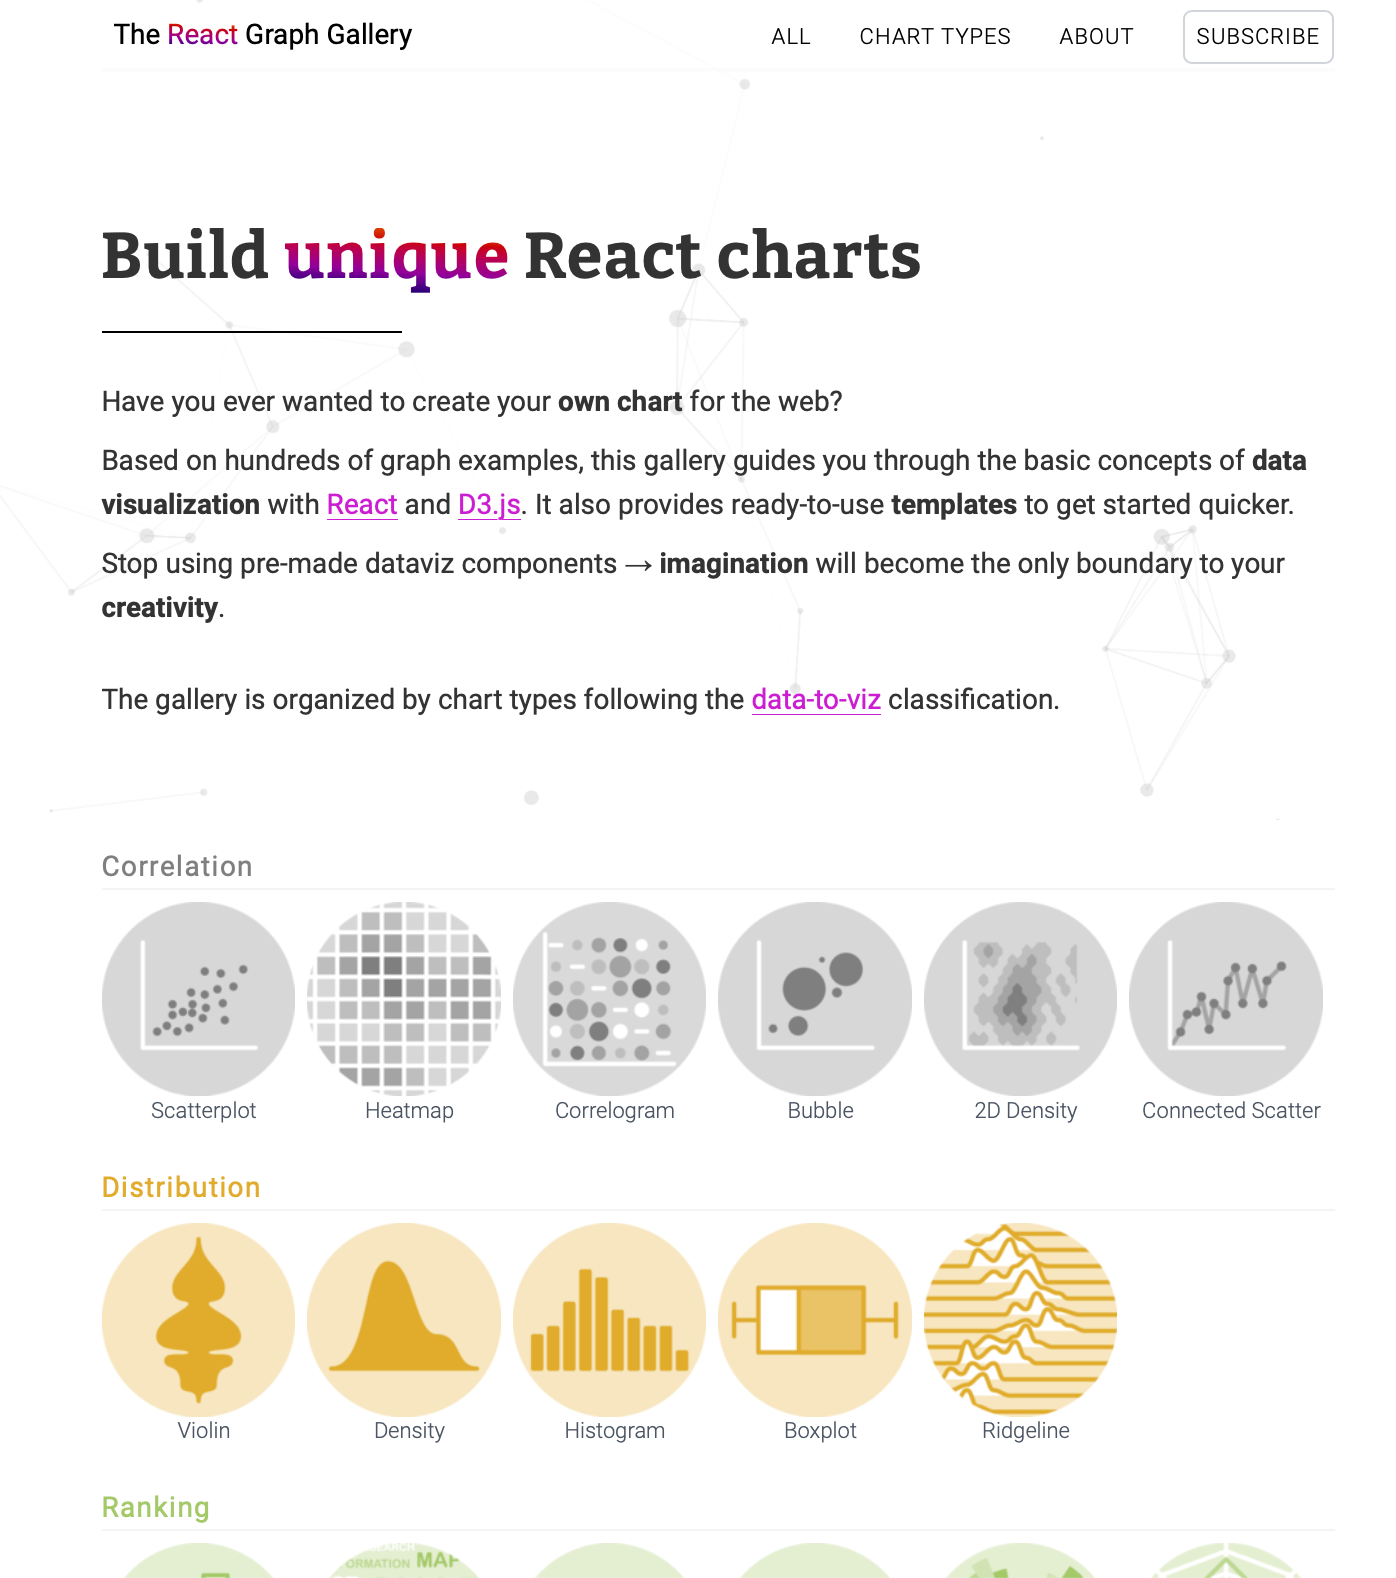
The react-graph-gallery.com ☀️🔥📈
Cool, but what’s this?
React 🤔?
React is a javascript library made to create web user interfaces.
Javascript is the programming language that makes a webpage alive. When you click a button of a website, there is probably some javascript that is run!
React is a library built on top of it, that is very, very, very convenient when it comes to create an application. It is very popular, check the state of JS survey!
Ok but React exists for years. People did not wait August 2023 to build charts with it!
Charting libraries
Many react charting libraries exist. ChartJs, Vega, Nivo, ReCharts, React Charts, Victory, VisX and so many more.
Most of them follow the same logic. They wrap some javascript and d3.js code to offer a set of graphic components.
At the end of the day, you just have to call the component to get your chart. Something like:<Boxplot data={data}/>And you have a boxplot.
🔥
Yes but,
There is a downside!
You are now limited to the set of options offered by the library!
Perhaps you want to add a color gradient to one of the rectangle of your chart? If the library does not have the option, you’re good to switch to another one and start everything again. 😭
Data Visualization is a complicated topic. The time you save upfront by using a library will be, most probably, regretted at some point.
This is why I suggest to create your very own chart from scratch.
A set of 150+ examples ❤️
This is why I created the react graph gallery!
The website displays hundreds of charts made with react and d3.js. All examples come with a sandbox, meaning you can play with the reproducible code to adapt it for you needs. It is very easy to copy-paste the chart component code to your project.
Charts are organized in about ~50 tutorials, 1 per graph type following the data-to-viz classification. It always starts very easy, and progressively increases the complexity by describing the most common kinds of customisation.
Coming next ➡️
The project is off to a great start 🔥. It’s been on the hacker news front page for a while, shared by the Bytes newsletter and I got some good feedback.
I am still actively working on the project. There are so many examples I want to add. I also want to write thematic articles that don’t target a specific chart type but general concepts like animation, interactivity, axes..
If you are a web developer, or if building charts for the web is something you want to learn, please take a look at the gallery and let me know what you think by hitting the reply button!
Your feedback / bug reports / suggestions / ideas / requests are SO valuable to me!
☀️ Cheers!
Yan


Well done