Streamgraph exploration
How is it build, what tool to use, main limitations and a few stunning examples 🔥
This week I’ve been busy adding some examples into the evolution 📈 section of the react graph gallery.
Streamgraph is one of the chart type I’ve been working on. Since I love them, let’s talk about this corner of the Dataviz Universe! 🪐
Streamgraph definition
An official definition could look like this:
A streamgraph (or "stream graph") is a type of stacked area graph which is displaced around a central axis, resulting in a flowing, organic shape.
A picture is worth a thousand words 🙃 so here is an example by Cedric Scherer analysing the most popular X-Men characters. (full R code tutorial available)
The evolution of several groups is represented. While not the most scientific way of representing a dataset, it definitely looks pretty.
How is it build?
Take a simple dataset: you have a few groups, each of them has a numeric value that evolves over time.
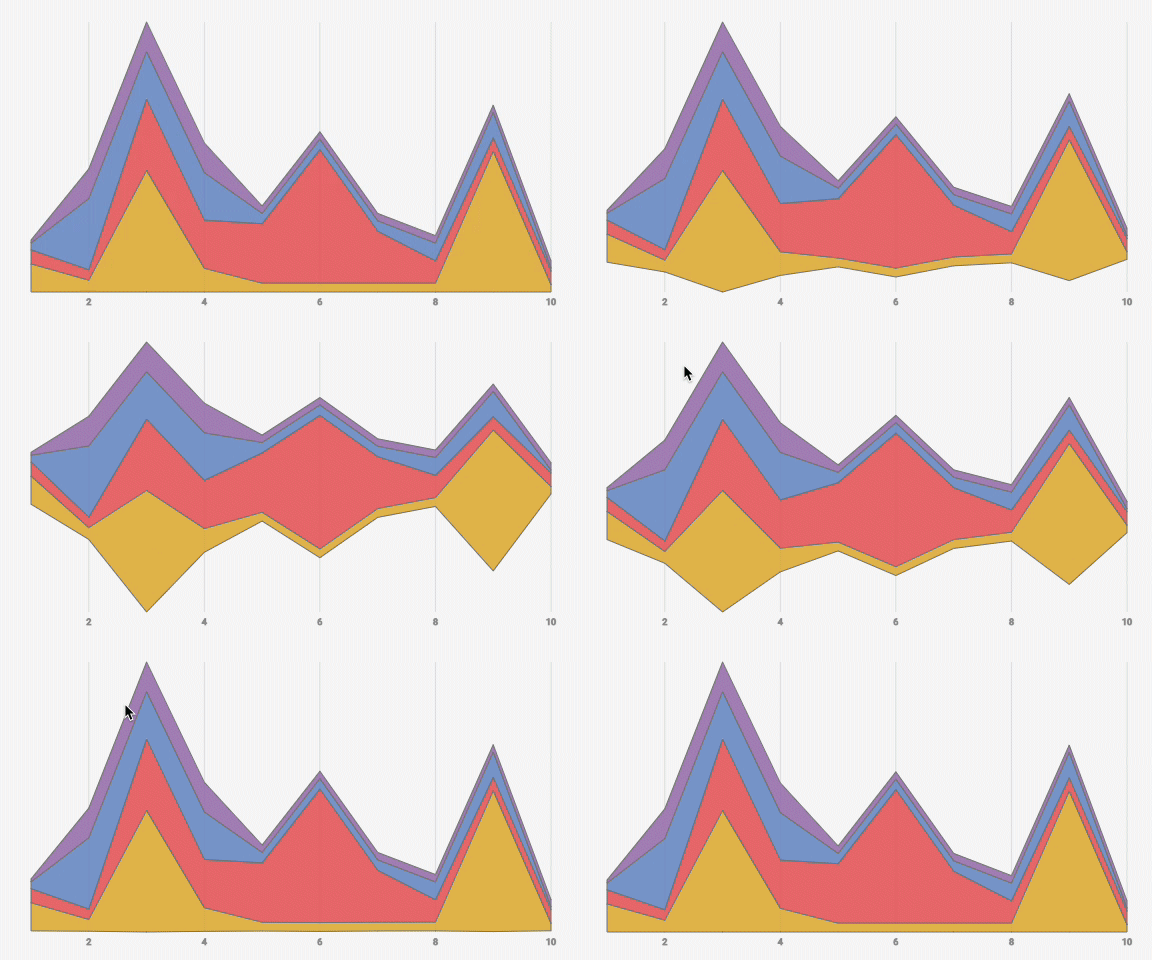
→ 0️⃣ Start with a stacked area chart
Start by building a stacked area chart. At each timestamp, the first group goes from 0 to its value. The second group goes on top of it and so on for every group and every timestamp.
If you are not familiar with the stacked area chart, read here.
→ 1️⃣ Change the offset type
The idea is to shift the baseline down such that the center of the streamgraph is always at zero.
See the evolution in the following GIF:
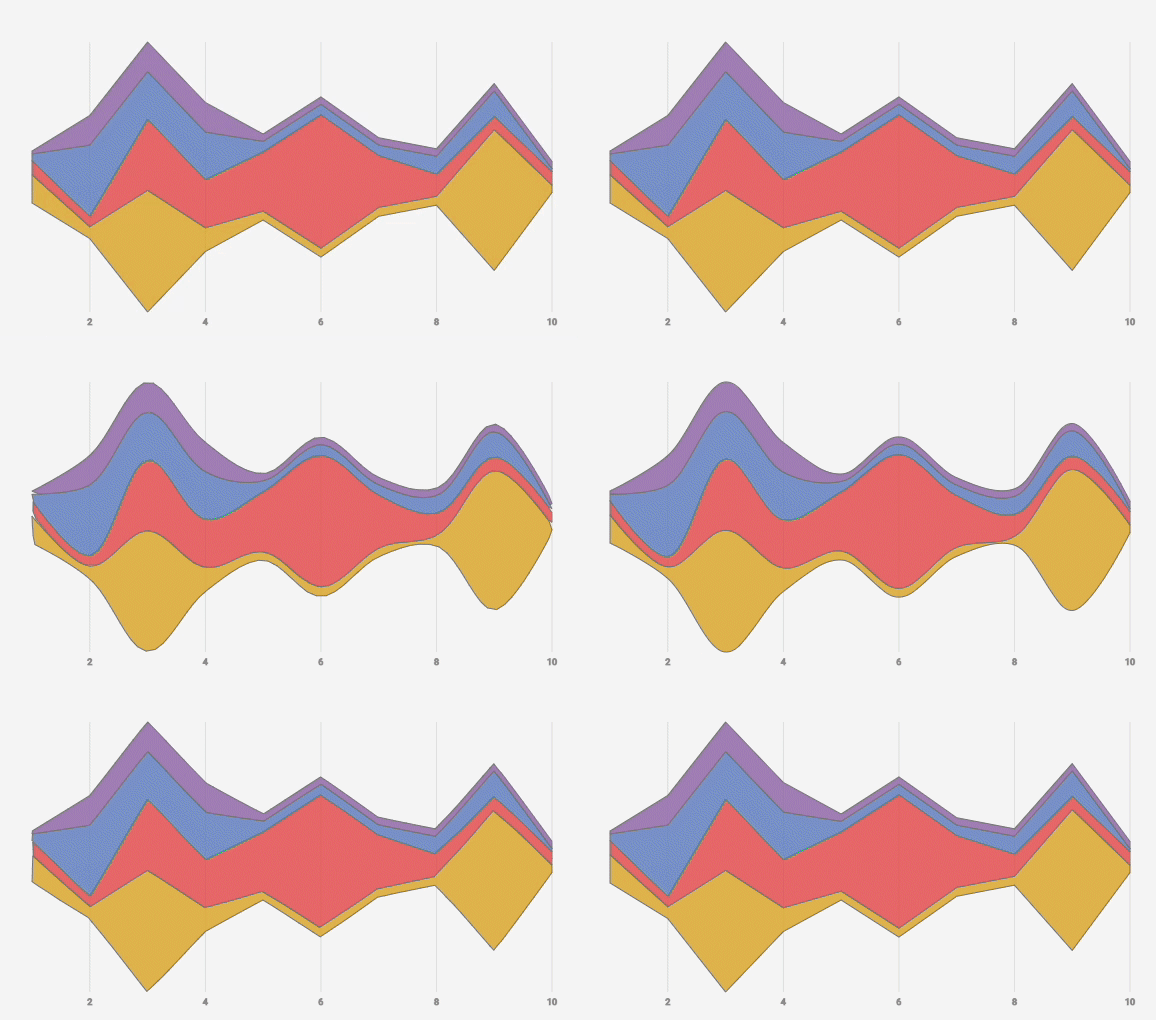
→ 2️⃣ Use curves instead of lines
Various algorithms exist for that but it’s often the cubic Catmull–Rom spline that is used for this matter.
This step makes the viz looks like it’s flowing, giving this good-looking organic shape.
What tool?
If you are a R user, the streamgraph package is definitely the way to go. You can find many examples in the R graph gallery. Note that it is an HTML widget, so you are running some Javascript under the hood 🔥.
With Python, both Matplotlib and Altair are viable options, you can find examples in the gallery.
If you are working on the web, you should definitely check d3.js. It has some wonderful utils tailored to build stream graphs. (d3.stack() and d3.area() I’m looking at you 😉).
And good news, I just published a long form tutorial explaining how to use those functions inside your React application.
Inspiration
I am constantly browsing the web in the quest of the best data visualisation projects.
I store my best findings in Dataviz-inspiration.com and the stream chart sections starts to have some good gems 😋!
If there is a streamchart you love, please share it with me! It probably belongs to this project 🙏
Streamgraph limitations
While streamgraphs are fascinating, they do come with a few limitations worth considering.
Firstly, labeling groups can be a challenging task. Incorporating a legend is not an optimal solution as it can clutter the chart and impede readability. Additionally, labeling directly on the figure becomes ineffective when the data is dynamic.
Secondly, streamgraphs lack a Y-axis, making it difficult to accurately interpret the exact values being represented. Without a reference point, determining the precise values becomes a challenging endeavor.
Lastly, similar to other stacked charts, streamgraphs pose difficulties in understanding the progression of specific groups over time. Since their baseline is constantly shifting, comparing the evolution of a particular group becomes more complex as there is no consistent starting point.
Going further
In my opinion, there is room for exploring new techniques and finding innovative solutions to address the aforementioned issues. Interactivity has the potential to offer workarounds that have not been discovered yet.
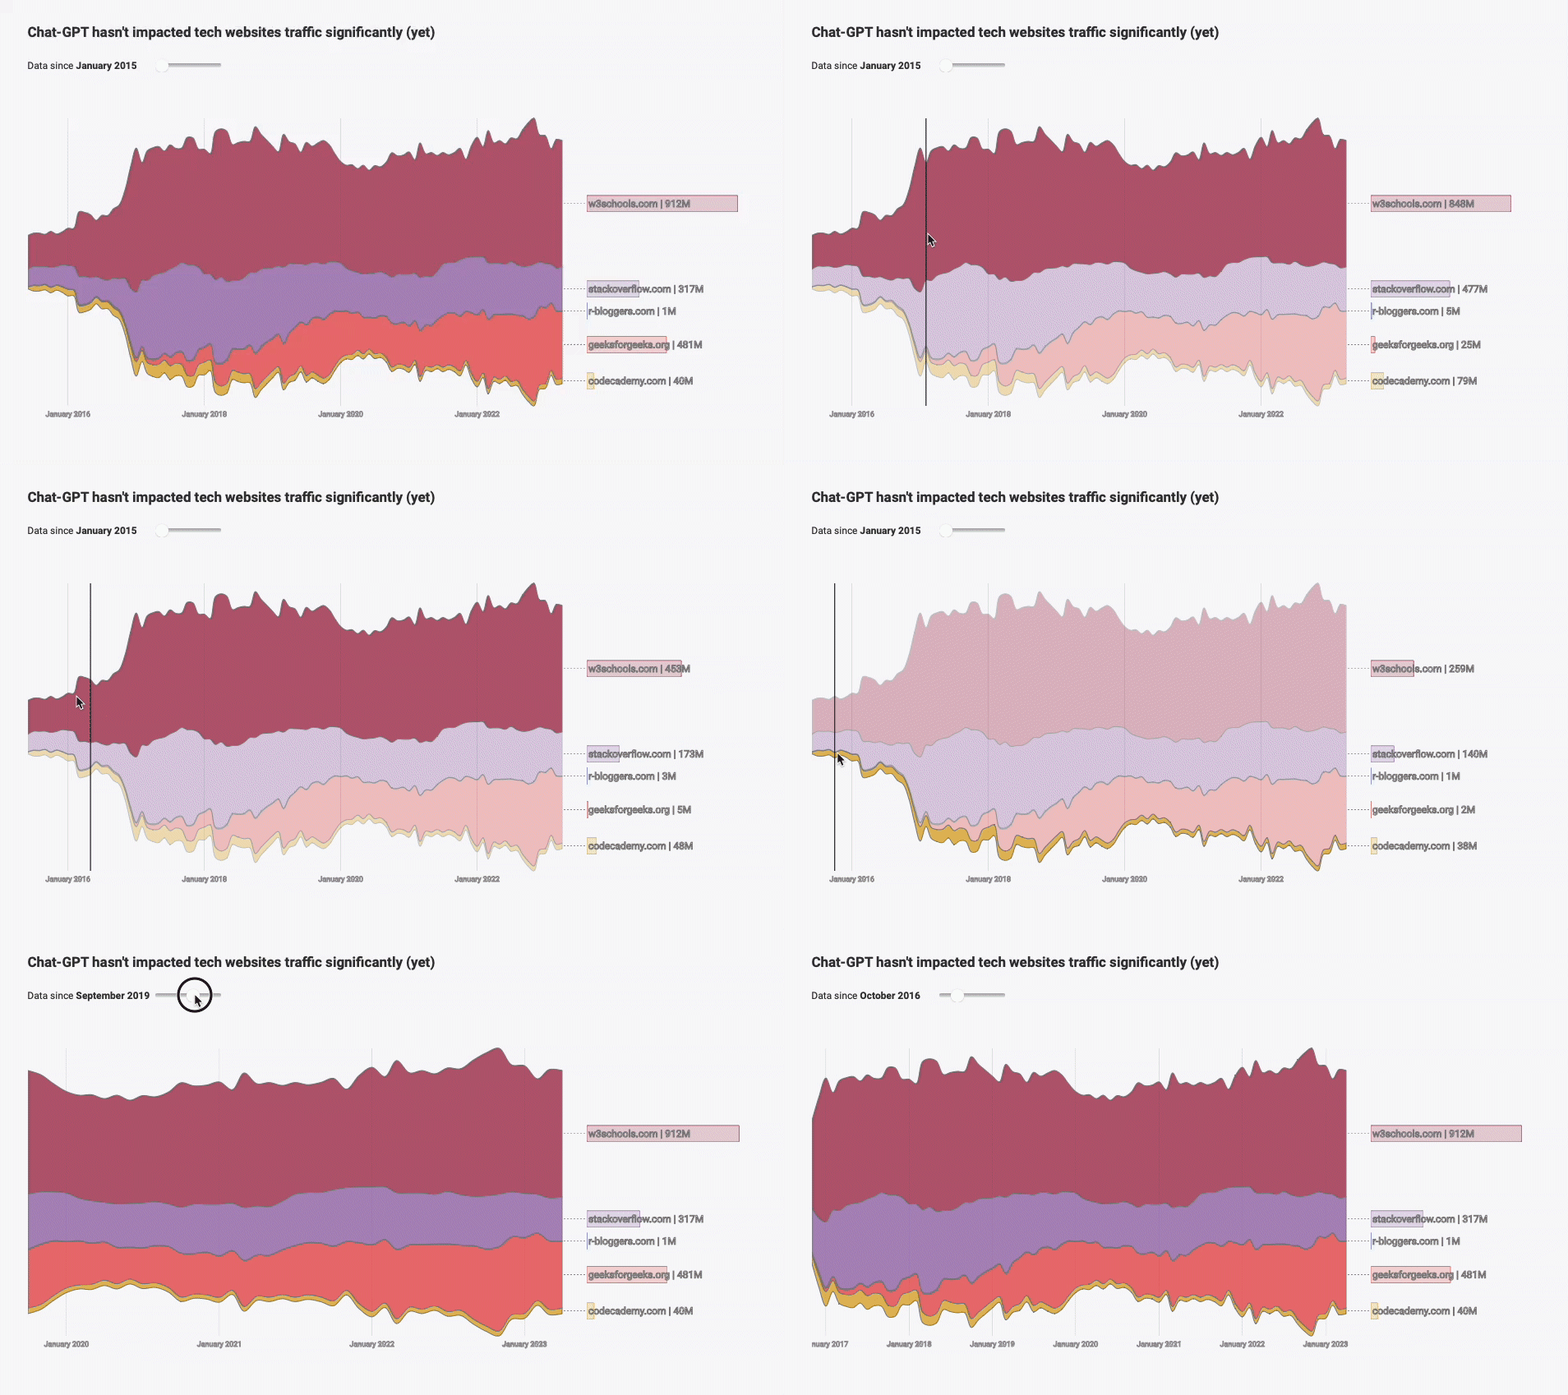
In the following examples, hovering over a group triggers a highlighting effect, facilitating comprehension. Additionally, inline legends are incorporated, displaying the corresponding values for the selected timestamp. This enables a more convenient comparison of all groups at a specific position.
While it may not be the most optimal solution, you can experiment with the interactive features and access the code here.
If you have any suggestions for further improvements, please feel free to share them with me.
Thanks for reading! 👋👋


