Navigating the table jungle
🍫 A review of the best R packages for building stunning tables
Have you ever tried to build a clean table with Python?
Well plottable is pretty much the only decent option. So at least you know where to start!
Have you ever tried to do it with R?
➡️ There are so many awesome options that it is easy to get lost! 🙈
A classification of the R packages for table
This month I created the table section of the R graph gallery! 🎉 It lists many table examples, together with explanation and reproducible code.
It helped me get a better overview of the various packages, and I ended up with this summary:
If you want to understand this classification in detail, I suggest to visit the gallery. I’ve made my best to describe the pros and cons of each option.
In this post, I’m just gonna show you a few of my favorite discoveries! 😀
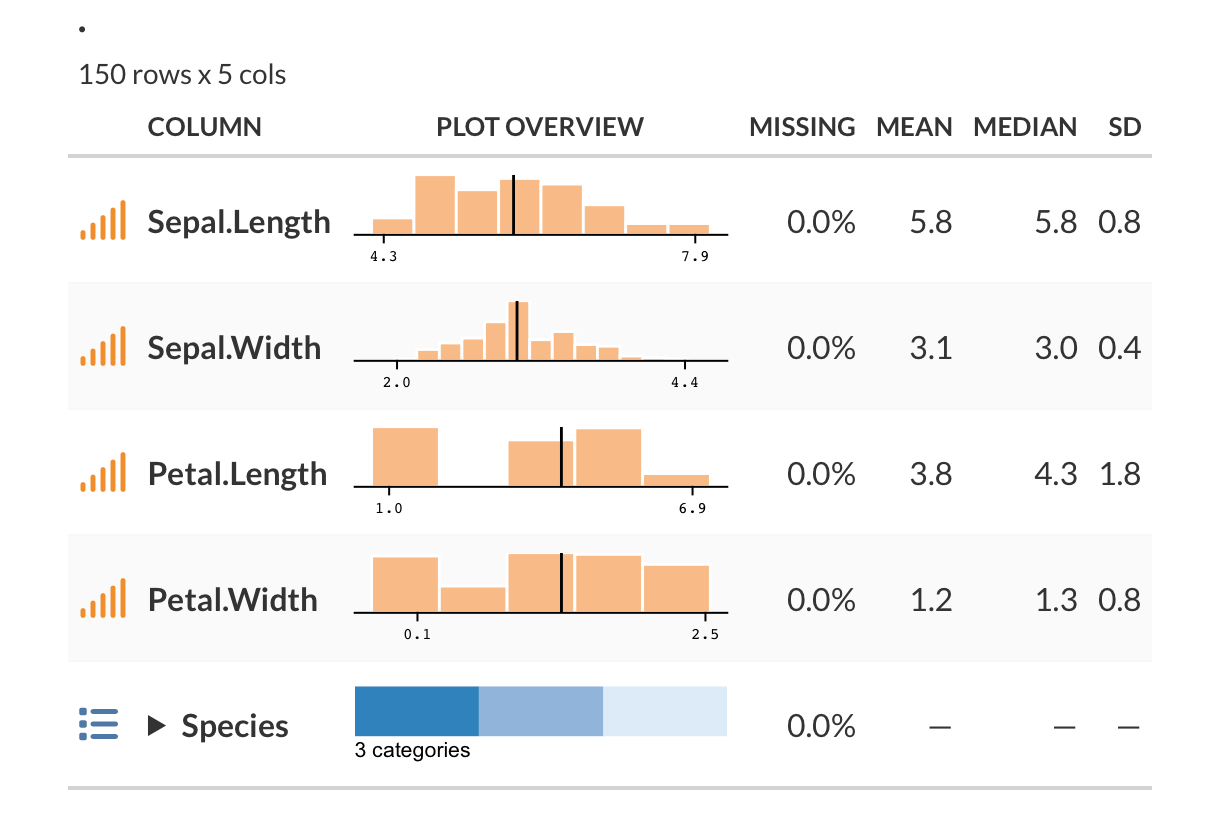
⚡️ Summarise a data frame in 3 sec
This is mind-blowing.
With just 1 line of code, gtExtras makes a very insightful summary of your dataset.
It creates a table with 1 row per column, telling you pretty much everything you need to know about it 😱
library(gtExtras)

iris %>%
gt_plt_summary()🧐 Searchable, filterable and sortable Table
One of my favorite trick!
With DT, you can very easily include a searchable, filterable and sortable table in your analysis.
This is so useful at the top of a Quarto / R Markdown document. It allows the reader to check the raw dataset if necessary.
❤️ Interactivity + Customisation with Reactable
Reactable is probably the best option to create interactive and customised tables.
Interactivity allows to add links, interactive charts, expandable rows and much more.
Below is an example made by szymanskir. Powerful!
➡️ Going further
Tables are a very powerful way to represent information. In my opinion, they are underrated in the dataviz world!
I hope the new section of the gallery will help guiding you to the table you need!
As usual, any feedback is very welcome so feel free to press the reply button!
Cheers!
Yan


Thanks for this one I periodically get confused on how to do nice tables in R and which packages to use, very convenient reference