Kicking off the Dataviz Universe
I wrote hundreds of dataviz blogposts already, but this is my first newsletter ever.
Hi, I’m Yan!
I’m a dataviz enthusiast.
I’m currently a senior software developer at Datadog, where I use React and D3 to offer a set of viz components used everywhere in the product.
But if you read this, it’s more probably because you visited one of my dataviz related website:
The R, Python, D3.js and React graph galleries: hundreds of tutorials explaining how to build a chart with those 4 programming languages
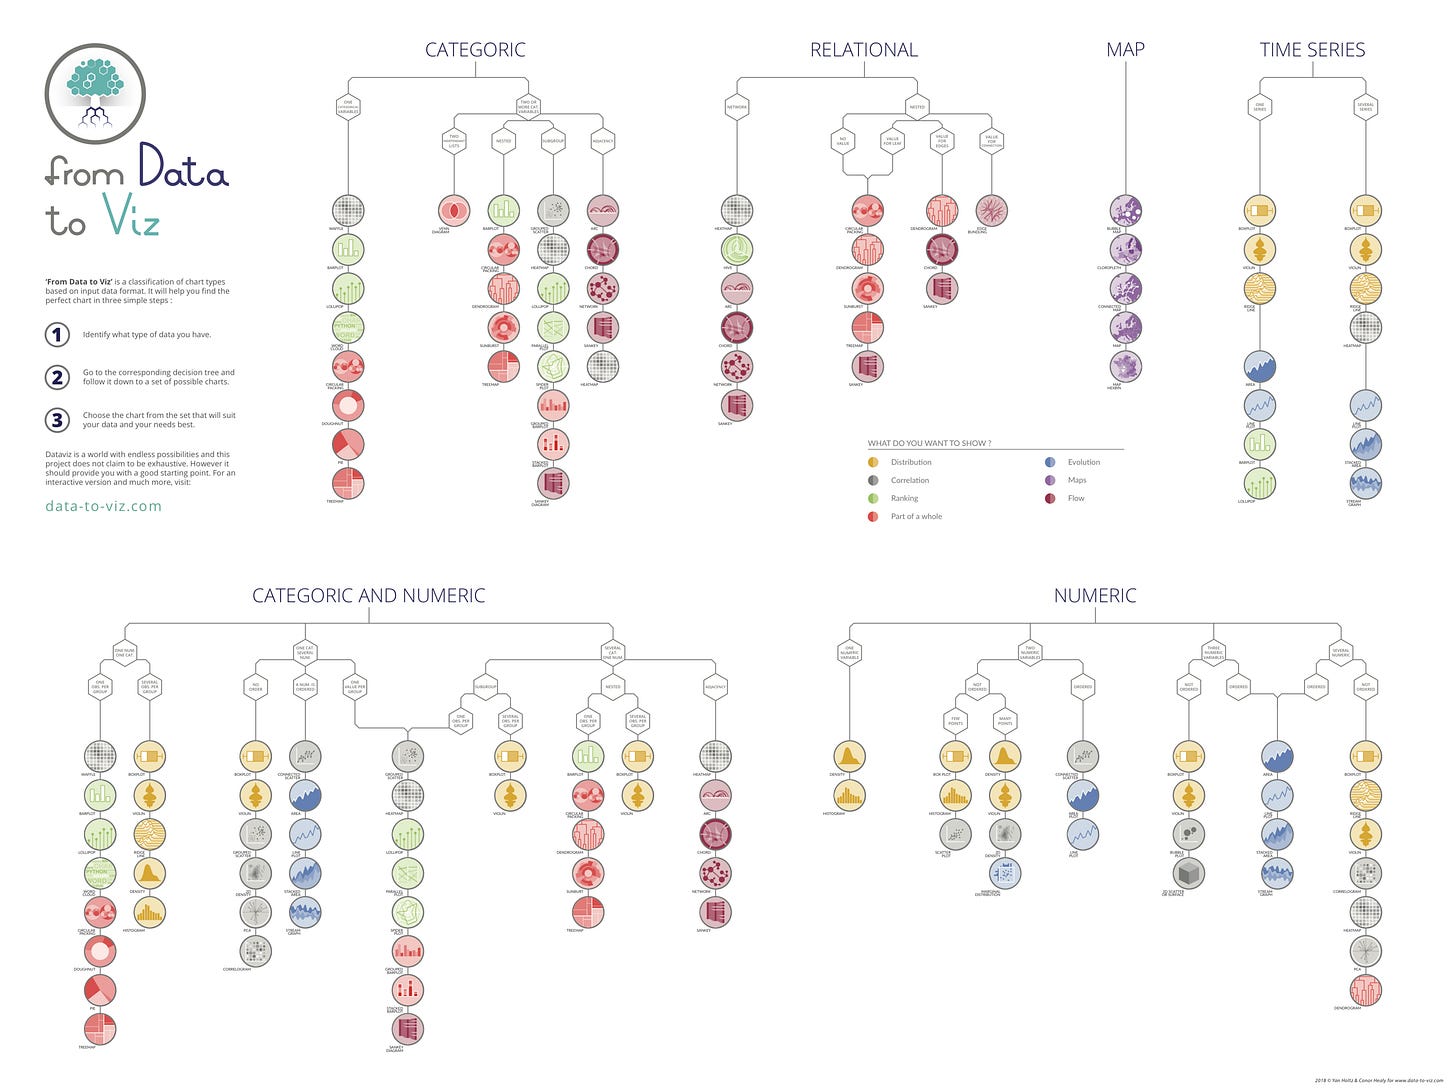
Data-to-viz.com: my takes on dataviz theory. What chart is appropriate to your dataset? What are the most common dataviz caveats?
Dataviz-inspiration.com: a pinterest style project with snapshots of all the best charts I know
Dataviz-blogs.com, a work in progress website where I aggregate all my favourite dataviz blogs

Why this newsletter
I often share my work and thoughts on twitter. It used to be a great place to exchange ideas and keep track with what’s happening in the dataviz community.
But things are changing quick and I’m not sure it is the place for the future.
I’m creating this new universe to share everything I learn and build about dataviz. Every now and then I will share the blog-posts I wrote. I’ll also probably go in depth in something I learnt about visual information. I’ll for sure share the best articles I read by other viz practitioners.
To put it in a nutshell, I’ll make sure you learn something new about data visualization.

I follow you on twitter but it's hard to focus on it all, looking forward to your newsletter!
Thank you for your wonderful work, very insightful and practical. I myself as a practitioner find delight in such a concise ordering... ;P